

White Paper
SANS Product Review: Swimlane for Incident Response and Visibility
Read More


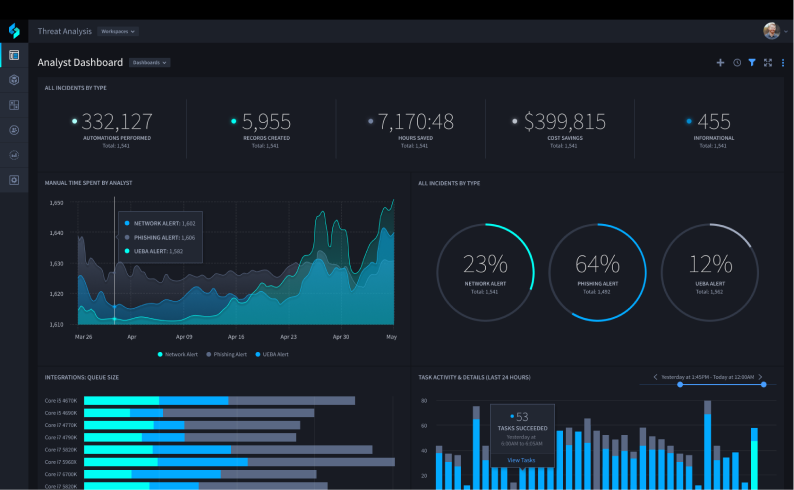
Swimlane Turbine gives teams out-of-the-box dashboards that bring critical SOC, vulnerability management, GRC, business continuity, and ROI metrics into focus.

Track alert trends, active investigations, queue status, MTTR, SLA risk, escalations, and analyst capacity.
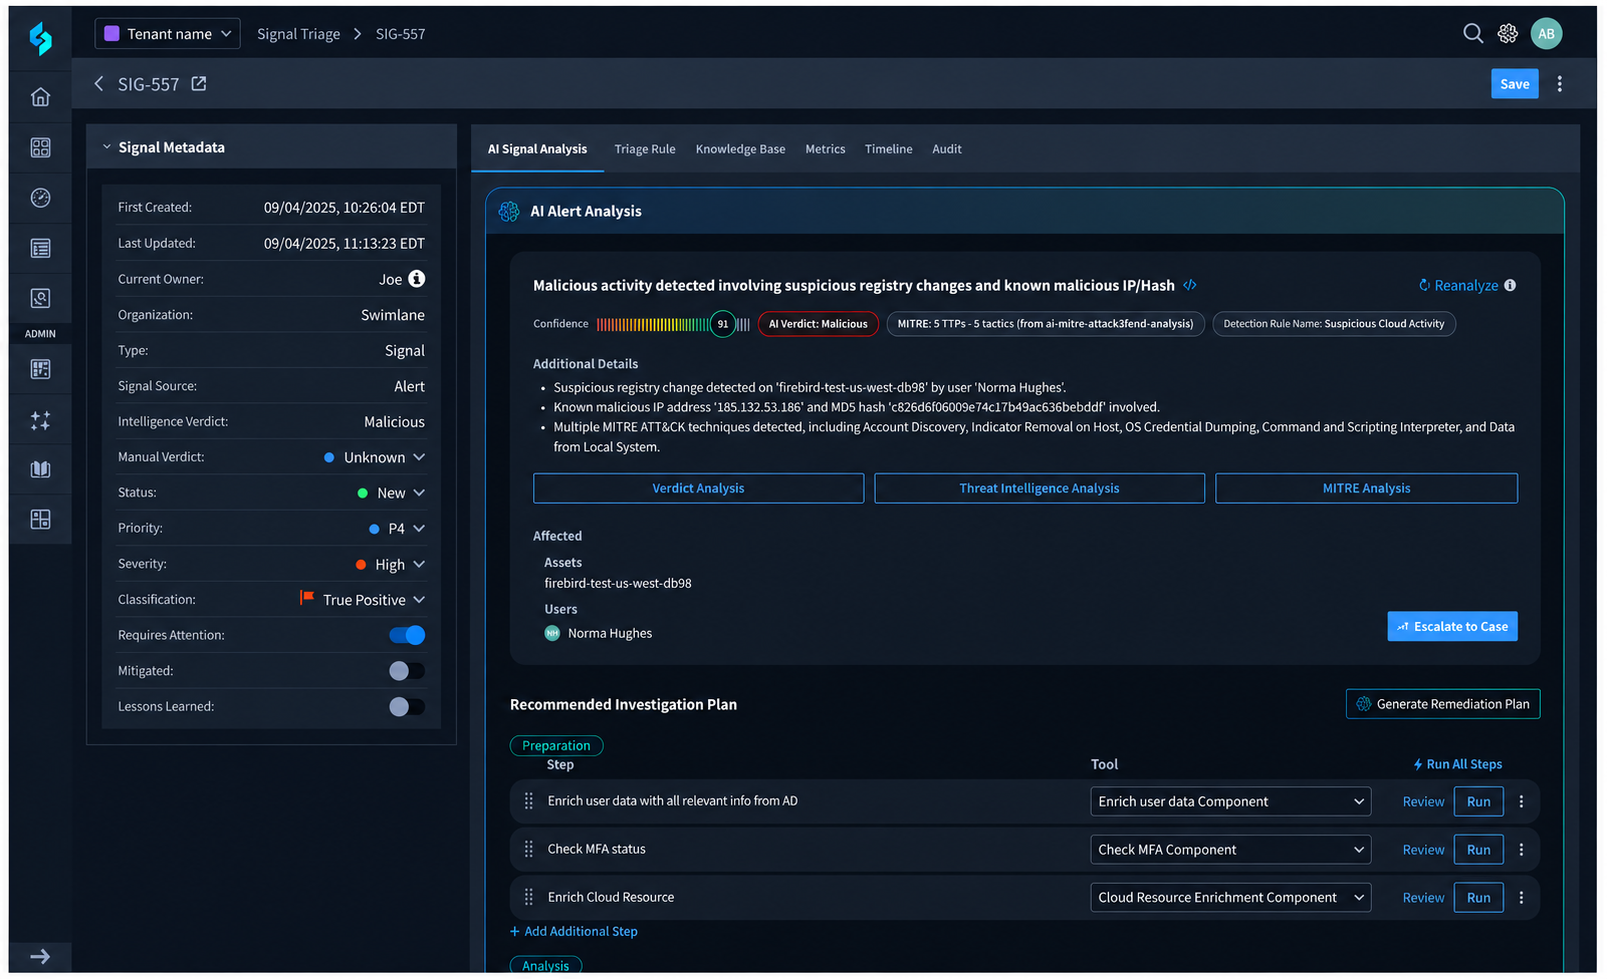

Monitor vulnerability activity, remediation progress, ownership, prioritization, and unresolved items.
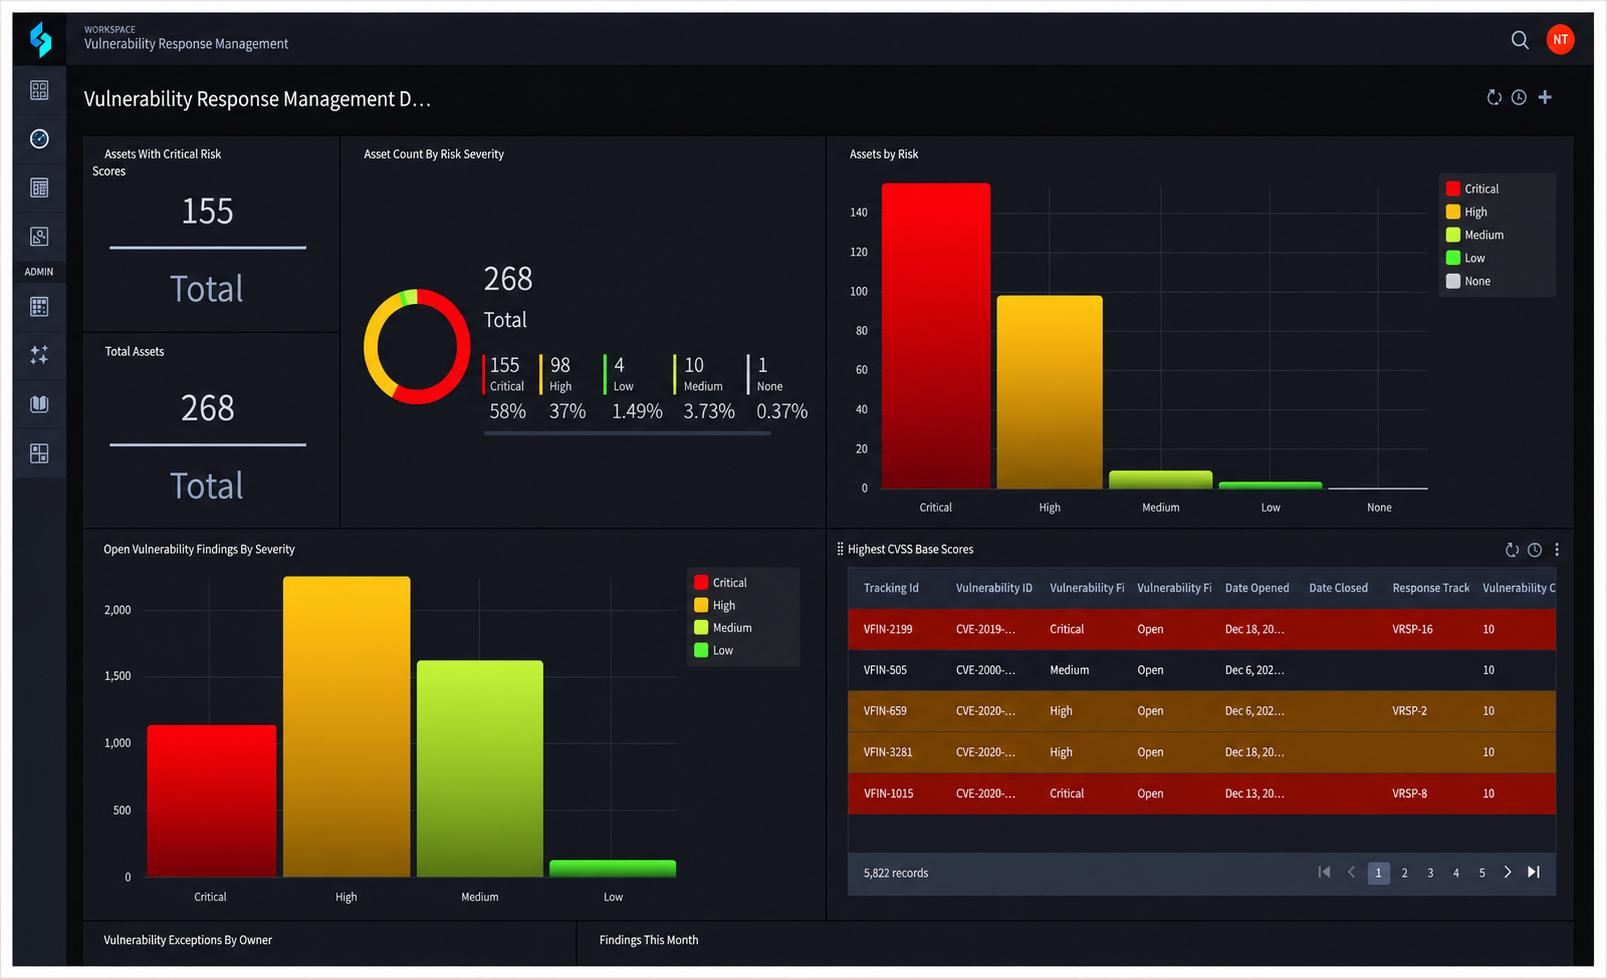

View audit readiness, evidence completeness, compliance tasks, approvals, and reporting status.
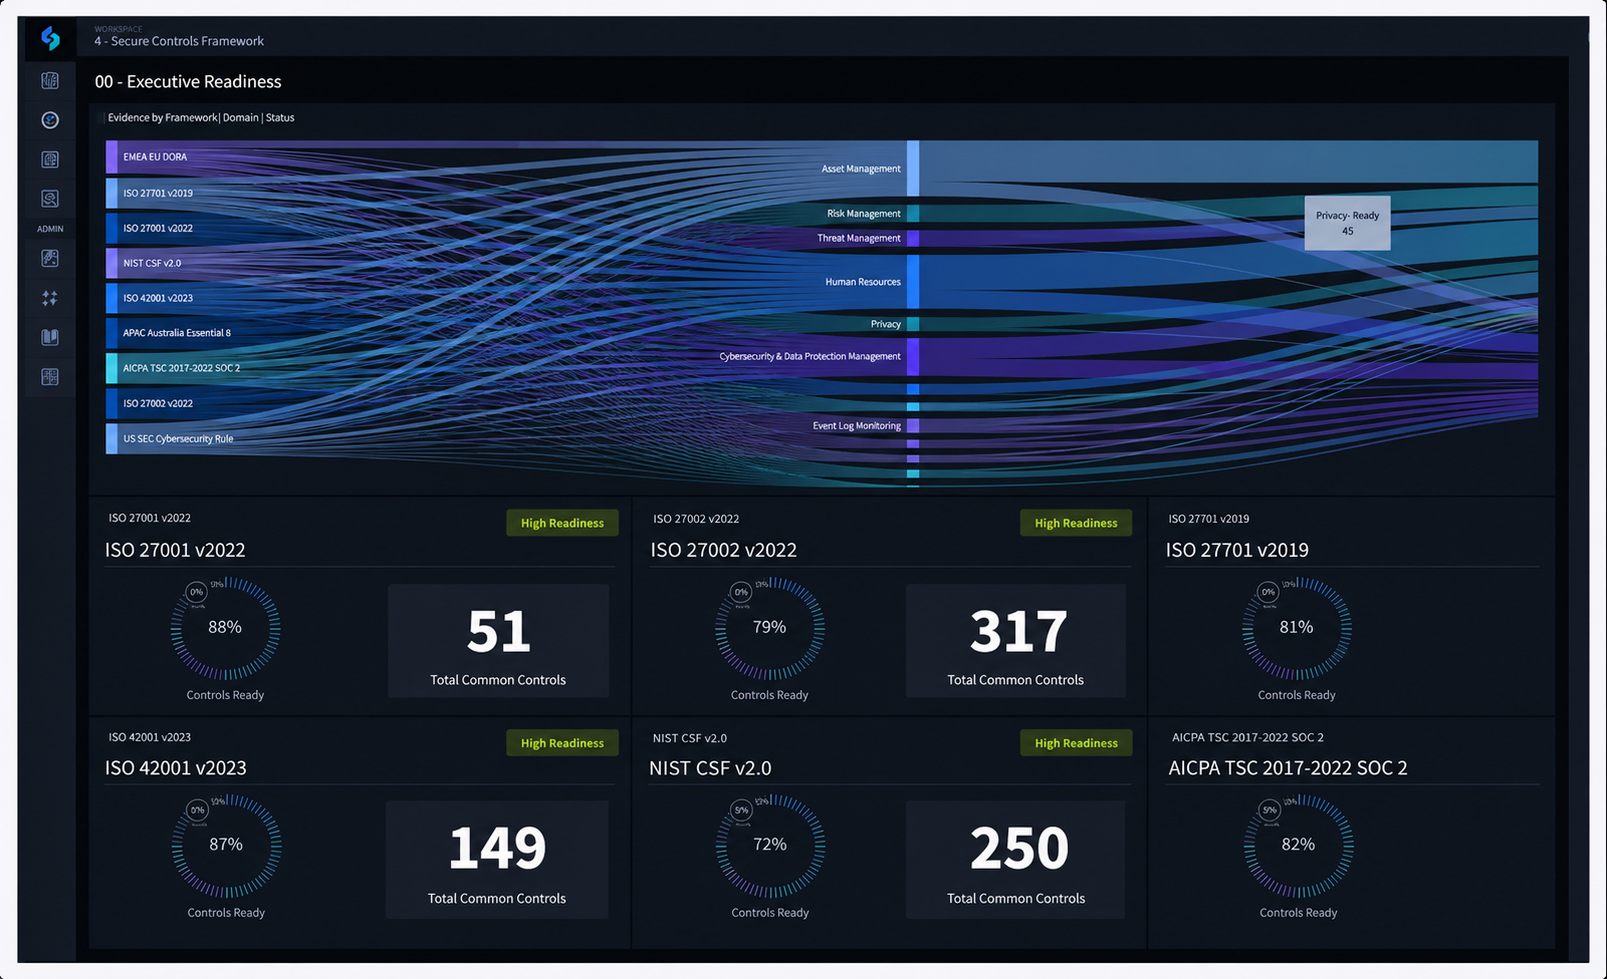

Track continuity workflows, open items, recovery activity, and process status during high-impact events.


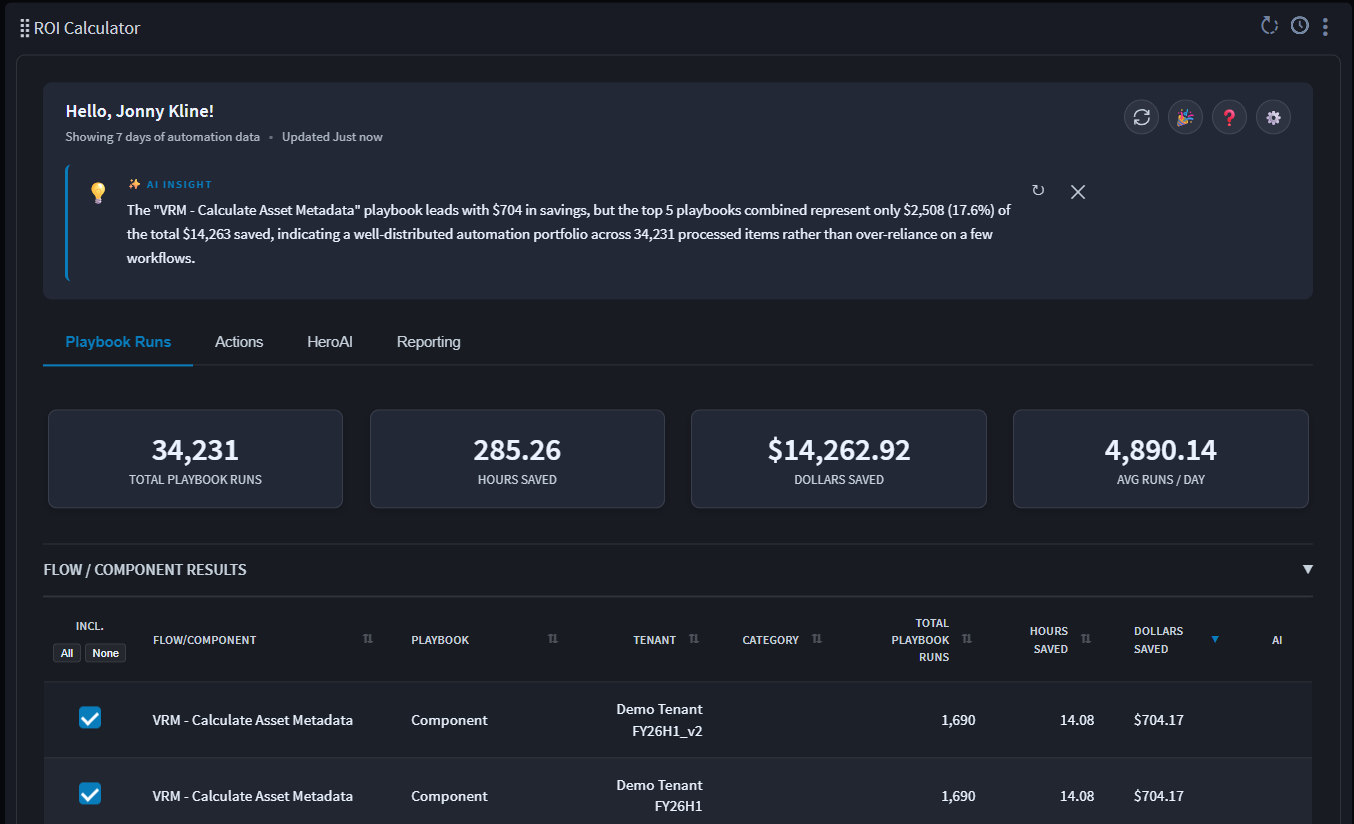
Measure hours saved, repetitive effort reduced, automated workflow coverage, and security operations efficiency gains.

Every SOC role needs a different view of security activity. Swimlane Turbine gives analysts, managers, CISOs, and compliance teams the clarity to see what needs attention and move forward with clear context.


See queues, active investigations, triage priorities, assigned cases, and next actions in one overview.
Track team load balance, case aging, SLA status, escalations, and response bottlenecks.
Analyze risk posture, MTTR trends, ROI, and security performance for leadership reporting.

Visualize historical records, other tools or observables across multiple business units to gain an end-to-end view of your security posture.

Prevent analyst burnout by using visual resources to monitor queue distribution, task load imbalance, and repetitive Tier-1 pressure, ensuring workloads remain sustainable before they become a containment risk.

Automatically track MTTR across all tools and processes. Turbine breaks down resolution time by threat type, severity, workflow, or business unit to provide granular insights into process efficiency and drive continuous SOC program improvement.
A Swimlane MSSP partner cut incident response time by 70% and saw both MTTD and MTTR fall sharply after automating SOC triage, containment, and reporting workflows with Turbine.

Track resolution deadlines, unresolved items, stalled investigations, and escalation patterns in a unified picture. SOC managers can see where execution is at risk before missed SLAs lead to longer response delays.

Measure the financial impact of how agentic AI automation improves your SOC’s bottom line. Track hours saved, manual dependency reduced, process volume, and coverage to show where automation is changing day-to-day SOC efforts.

Monitor triage time, containment progress, remediation status, and post-incident reporting activity. Teams can follow each threat from first triage through resolution and spot where the process needs attention.
Swimlane Turbine dashboards surface the signals teams need to track triage speed, capacity strain, orchestration impact, and reporting readiness.
| Metric Area | What Swimlane Dashboards Surface | |
|---|---|---|
Response Speed |  | MTTD, MTTR, containment time, and remediation progress |
Alert and Case Volume | | Alert volume by source and queue volume by severity |
Workload Pressure | | Analyst capacity, queue status, active investigations, and stalled events |
SLA Risk | | Containment commitments, approaching deadlines, overdue cases, and escalation trends |
Automation Value | | Automation coverage, human hours saved, and repetitive actions reduced |
Reporting Readiness | | event timelines, completed actions, outcomes, and stakeholder-ready reporting data |
Swimlane Turbine turns activity trails, mitigation timelines, containment actions, and dashboard metrics into structured reports for leadership updates, compliance requests, and post-incident reviews.
Send recurring AI-backed updates to CISOs, SOC managers, compliance teams, executives, or customers. Each report can highlight trends, open items, and recurring gaps on a scheduled cadence.
AI autonomously generates post-incident activities from case management, including timelines, key decisions, actions taken, evidence collected, and remediation outcomes. Teams can export the report from Turbine and share it after review.
Give customers a clear account-level analysis of resolved actions, open items, SLA status, and recent security activity. Turbine reporting helps MSSPs communicate service performance without having to rebuild every customer update by hand.
Swimlane Turbine gives managed security teams the dashboard and reporting insights to track client activity, monitor SLAs, and communicate service value without rebuilding reports account by account.

We notify and get responses from customers all within a single pane of glass from the Swimlane dashboards.
Chase Hood
Technical Team Lead, Managed Services
AHEAD


I would recommend Swimlane to my peers, to all security operations departments and even to the C-level. It gives you a very robust look into the environment and gives your analysts the abilities to work efficiently within a single platform.
Jonathan Kennedy
Chief Information Security Officer

We use Swimlane as a central repository for all of our data coming in. We use it to automate all of our other tool stacks, to bring our tech into almost a ‘single pane of glass’ situation. That really allows them to work in one area – no one product, no one software – that keeps it easier for training, learning, and overall quality of life.
Zach Tielking
Chief Cyber Forensicator
Swimlane tracks comprehensive SOC metrics, including MTTR, MTTD, alert volumes, SLA status, analyst capacity trends, and automation ROI (manual hours saved).
Swimlane leverages AI to automatically transform activity trails and case timelines into structured summaries for post-incident analysis and executive briefings.
Yes. Swimlane Turbine dashboards can include widgets to help teams track the value of AI and automation by showing hours saved, reduced repetitive work, workflow coverage, and operational impact.
Swimlane Turbine creates structured reports from dashboard and investigation data, but teams can review, refine, and approve the output before sharing it with executives, compliance teams, customers, or other stakeholders. This keeps AI-assisted reporting fast without removing human oversight.
Swimlane dashboards and reports can organize event history, timestamps, actions, evidence, approvals, and remediation records. Compliance teams get a cleaner overview of what happened, who acted, and what was completed.
Swimlane Turbine dashboards pull MTTR, MTTD, and SLA data from every tool into one live view, so SOC and MSSP teams track compliance in real time instead of assembling it after the fact. Teams can break down MTTR by threat type, severity, or business unit, and flag SLA risk before deadlines are missed.
 English English
  Français
 Deutsch
 日本語
日本語
 한국어
한국어
 Português
 Español