
Case Studies
Victrix Replaces SOAR with Swimlane Turbine, Migrates a Year of Work in Three Weeks
Read More


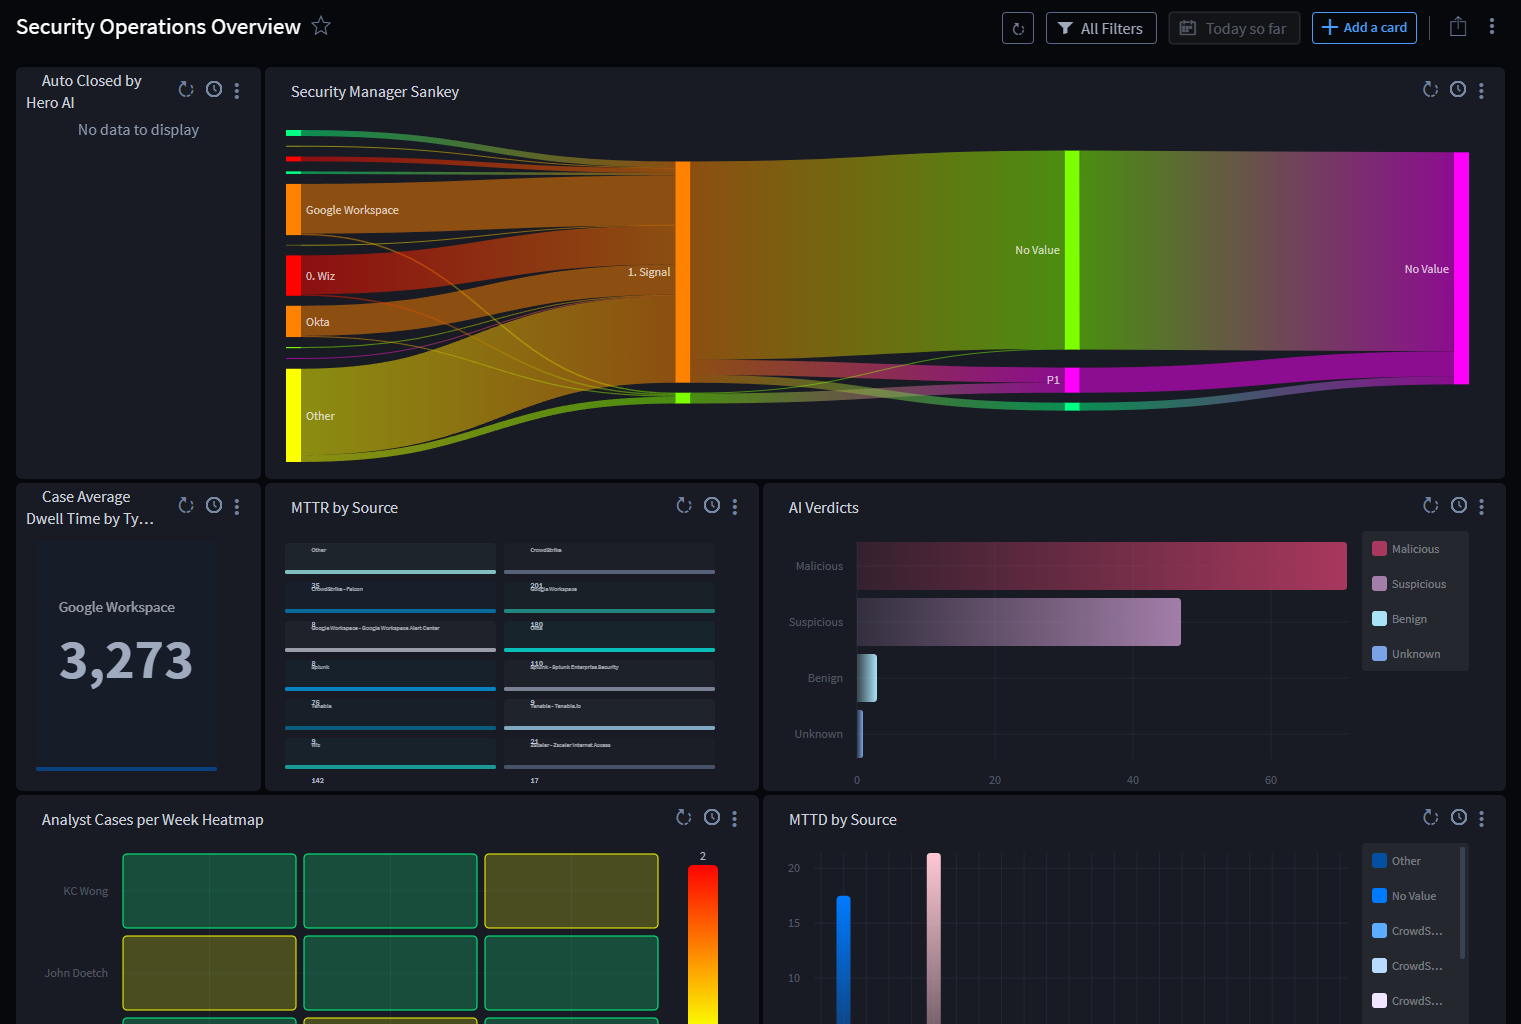
See how your SOC performs across detection, triage, investigation, and response with clear visibility into MTTD, MTTR, analyst workload, false positives, and automation performance. Help your team continually improve SOC maturity with actionable insights from dashboards and reports.
$
k
A Fortune 100 financial services company reported saving $900k/year with Swimlane.
%
Thetabyte saw a 70% improvement in incident response KPIS and contains threats in under 5 minutes.
%
Thanks to Swimlane efficiencies, Victrix plans to promote 50% of its L1 analysts over the next 6 months.
A picture speaks a thousand words, and so does an automated dashboard. Swimlane Turbine’s playbooks self-document into highly composable SOC dashboards and reports that will provide actionable insights to help you continuously mature your SecOps program.
Case management helps you keep pace with threats without being overwhelmed by task switching or slowed by manual tasks.
Comprehensive security orchestration provides visibility into all integrated tools so you can track critical SOC KPIs and quickly identify gaps.
Whether you want the ROI of an individual component of your tech stack or the ROI tied to your staff’s effectiveness, Turbine can help you calculate it at a granular level.

Explore the Return on Investment (ROI) calculator widget in Turbine, a powerful visualization that translates playbook runs, action executions, and Hero AI prompt usage into tangible time and cost savings.

Security automation platforms can track every step of the incident response process to help you measure the effectiveness of your SecOps processes. SOC dashboards make it easier to drill down into specific metrics, like MTTD or MTTR, in order to understand where time can be saved. Break response time into triage, investigation, containment, and resolution to see where incidents are slowing down and where automation can improve performance.

Analyst burnout is the most pervasive challenge security teams face, yet many leaders struggle to mitigate it effectively. Dashboards with built-in workload monitoring make it easier to see when resources need to be reallocated in order to avoid analyst burnout, or when staff members need additional training.
SOC metrics measure specific aspects of security operations, such as investigation time, case volume, or analyst workload. SOC KPIs connect those measurements to broader objectives, such as reducing response times, improving operational efficiency, or increasing automation.
Security teams should track metrics across detection, triage, investigation, response, analyst workload, and automation. Common examples include MTTD, MTTI, MTTR, false-positive rate, case backlog, SLA adherence, automation coverage, and security automation ROI. Together, these metrics show the bandwidth gains that automation and AI provide your team, translating into greater capacity to reduce risk.
MTTD measures how long it takes to detect relevant security activity, while MTTI measures the time spent investigating and reaching a verdict. MTTR measures how long it takes to move an incident through response and resolution, giving teams visibility into different stages of the incident lifecycle.
You can measure SOC efficiency by looking at response times alongside workload, case backlog, case aging, escalations, SLA performance, and manual effort. Together, these metrics show where work is accumulating, where processes are slowing down, and where additional automation or workflow changes may be needed.
You can measure security automation ROI by comparing outcomes such as analyst hours saved, automation coverage, response-time improvements, and operational capacity before and after automation. You can then evaluate these gains against the cost of the technology and the resources required to operate it.
 English English
 Français
 Deutsch
 日本語
 한국어
 Português
 Español